User guide
Create a New Analysis
-
On the top navigation bar -- click on
"Reports > Create New".
-
Under "Select Data source :"
-- choose the data source (OLAP server) that has the cubes
for your project
-
Under "Select Cube :" -- Choose
appropriate cube that are listed on the List, these lists
will populated on the basis
-
Click on "Ok" to create analysis
or Reset to reset Values
-
Once you click on "Ok" you will
be taken to the reports page if you click on the "Customize"
tab on right it will present a list of all dimensions available
in the cube

You can drag and drop the filters available on the "Columns"
or "Row" boxes as per your choice and hit the
"Ok" button to see the change on the "Data"
Tab or on the "Chart" tab or Click "Cancel"
button to reset to default
- To select dimension level for a dimension, click on the
pencil like icon on the right
 .
You will see a list of all dimension levels available in the
dimension. .
You will see a list of all dimension levels available in the
dimension.
- To expand dimension level, click on

- To collapse dimension level, click on

- Once you have the right dimensions placed under Row and
Column -- click on OK -- this will process your input for
a few seconds -- and result into a bar graph (and associated
table) displaying the data for the dimensions you chose
- On the right side of the page you have "Save"
and "Save As" buttons to save the report
- Save as public or private
- Saving an analysis as "private" means that the analysis
is viewable only by you. If you don't have it already,
the app will create a private folder in the left navigation
under your username, and you will see the analysis listed
under it. You will choose this option when you want to
"play around" with the data on your own before sharing
it with the rest of the team members.
- Saving an analysis as "public" analysis means it is
viewable by everyone who has access to this project. You
will choose this option when you want to share your analysis
with the rest of the project team.
- Caveat: Best practice is to use only alphanumerics (letters
and numbers only, no symbols if possible).
- Once you save, you should see the analysis listed in the
left navigation bar under the appropriate folder
Modify an Analysis
When you bring up any analysis, there are several check boxes
displayed up top of the chart/table as:
This provides you several options to configure the look and
feel of the display, as well as apply the relevant filters to
display just the data that you want to focus on. Here is a brief
summary of these button functionalities:
 (Save Analysis)
Saves the analysis overwriting the existing copy. Best practice
is to use only alphanumerics (letters and numbers only, no
symbols if possible).
 (Save
Analysis As) (Save
Analysis As)
Saves the analysis under a different name. This is useful
for moving an analysis from private to public area, or vice
versa. Best practice is to use only alphanumerics (letters
and numbers only, no symbols if possible).
To export report on PDF or on Excel format move you mouse over
the export button 
 (Swap
Axes) (Swap
Axes)
Check Box to swap axes, moves dimensions from X axis to
Y, and Y from X
 (Hide Empty Row/Columns)
Check Box to Hide Empty row or Columns, i.e. if a row or
column has all null values, they will not be displayed
 (Show
Hierarchy) (Show
Hierarchy)
Check Box to enable "Show Hierarchy" on Data tab
on/off. "On" means names of all the parent levels
of the dimensions will be displayed, "Off" means
only the current dimension level's name will be displayed
 (Show
Table) (Show
Table)
 (Show
Chart) (Show
Chart)
 (Properties Button)
Click on the Properties Button to change the properties
of the reports, which will bring up a popup box:
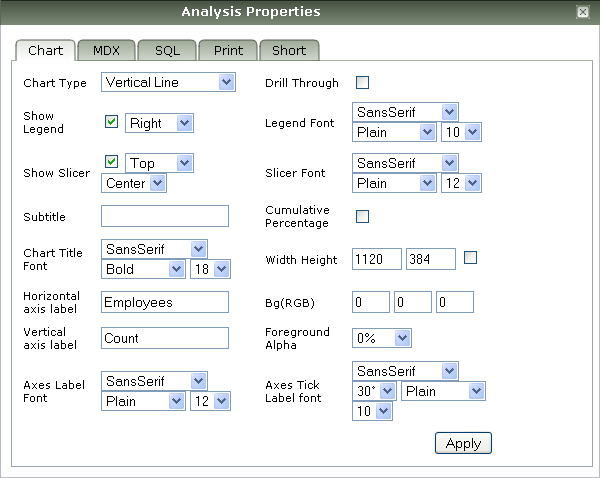
Chart Tab
Brings up chart configuration settings in the left navigation
pane, where you can change the chart settings such as chart
size, title, font, axes labels, etc. By default, the application
sets these up to project defaults, and chart size is set according
to your browser display size. This option allows you to overwrite
all that.
MDX Tab
Displays the MDX syntax for the current analysis display.
This is useful if you want to overwrite the MDX query with
a customized query. More useful for advanced OLAP users.
SQL Tab
This is for writing custom SQL query for queued drillthrough.
To use this, the OLAP Cube must be configured to return drillthrough
results with key column only. The custom SQL query should
be in the following format :
SELECT col1,col2,..,coln
FROM table_1, table_2.. table_n
WHERE .... AND xx_key IN (?) ORDER BY ...
Please note that query must have "xx_key in (?)"
condition in the WHERE clause. OpenI replaces "?"
with the keys returned from drillthrough request. If the custom
SQL table is empty, OpenI directly saves raw drillthrough
results in a file under the user's private folder.
Print Tab
Print settings like page orientation, Paper size etc.
Sort Tab
-
Sorts the current measures in ascending order. Clicking
again sorts descending, and if you click again, goes back
to natural order.
-
Next to each measure in the table, you will see normally
see a blue dot icon  (if the measures are being displayed in their natural order).
-
Clicking on the blue dot first does an ascending sort
on that particular measure attribute, and displays a red
arrow tip  in the direction of the sort
-
Clicking on the red arrow again does the sort in descending
arrow, and the red arrow flips 
-
Clicking on the red arrow again brings the data back to
the natural order, and the blue dot
is displayed back
"Data" tab options

Hierarchy Check Box
Turning this check box on enables drilling from a high level
member to members in lower levels, while still showing the
parent level members. For e.g. in a geographic location dimension,
if you drill down from region to city level while Drill Position
button is on, you will see the city level information as well
as the region level information. When this mode is on, you
will see a blue + sign next to the parent level dimension
member which expands when you click on it, displaying the
child members.
Replace Check Box
Turning this check box on also enables drilling from a high
level member to members in lower levels, the big difference
here is that it only shows the children members, and not the
parent members. For e.g. in a geographic location dimension,
if you drill down from region to city level while Drill Replace
button is on, you will only see the city level information,
and the region level information will be hidden. When this
mode is on, you will see a red arrow sign next to the dimension
members. The direction of the arrow indication whether you
are going "down" from parent level to children level, or if
you are going "up" from children to parent level.
Data Report Check Box
-
This features enables you to drill through a measure value
and get the detailed data underneath it. For example, with
this feature enabled, you can click on a count of customers,
and get a list of the underlying customer identification
numbers (and other associated information such as their
account number, name, email, etc.) -- so, it is very helpful
with list cutting type of features, or just looking at details
underneath any summarized data.
-
Drill through is a feature that must be enabled in the
OLAP cubes first. If the OLAP cube has drillthrough enabled,
clicking on this button will show a blue arrow next to the
measures. When you click on the blue button, it will query
the underlying database, and bring up screens that list
the individual records. It can also be implemented to produce
a downloadable file instead of displaying the detailed records
on the web page.
"Graph" tab options
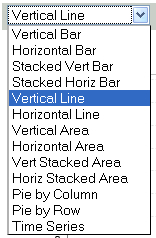
This is a list of all the different chart representation
supported by the application. Choose the desired chart type
and click the Apply button to change the chart type.
Setup RDBMS Reporting
- Configure a JDBC data source:
- Go to menu "Preferences->Manage Data Sources"
- Click on "New->JDBC Data Source"
- Create a report using a jasper report creator (such as
iReport), create a jrxml file. See jaspersoft for more info
- Upload the jrxml report file using manage files "Preferences->Manage
Files"
- In Report navigator tree, right click on uploaded JRXML
file and select "Edit Data Source"
- In popup window, select a valid data source
- Click on the jrxml file to run the report
|
|